Lab Monitoring Report
Overview
The Lab Monitoring Report allows you to review your Lab Analyses.
Creating a Report
To find the Lab Monitoring Report, go to Quick Reports on the Operations Dashboard in the Make > In the Winery area.
Use the supplied drop-down menus to input the criteria for your report, adding any filters and grouping, the same way you would to an other report. See Reports – How to Use / Customise
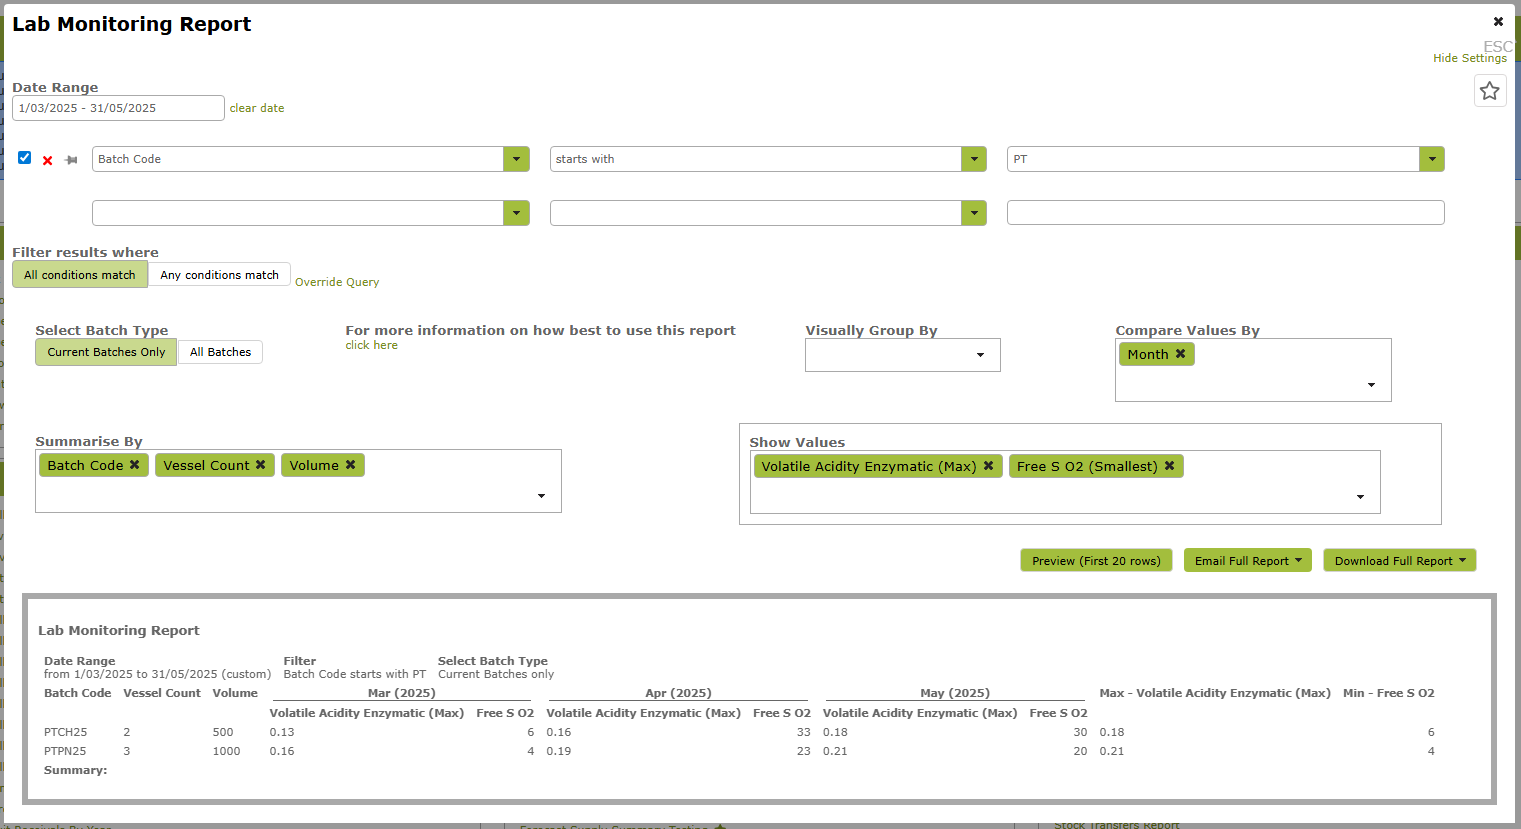
Selecting Values to Show (“Show Values”)
It is when selecting the values to show that you need to take a bit of care in this report.
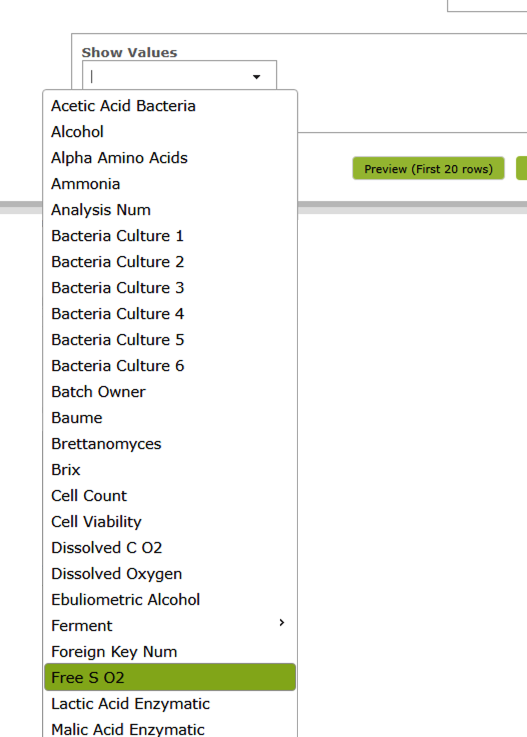
First select the analysis you are interested in viewing from the drop down list:
You will then be given the option to look for the ‘Sum, Average, Smallest, Largest or Count”
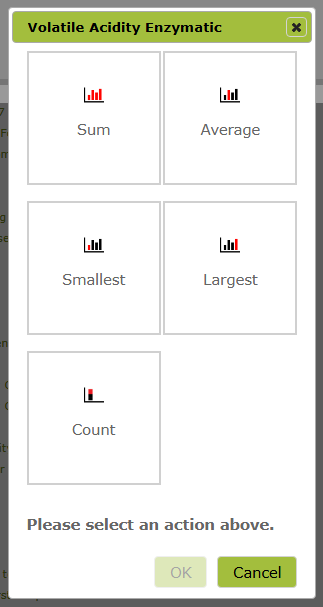
What you select here will depend on the analysis you are viewing. For example if watching the bulk to see when a value rises to a certain threshold, it will probably be the “largest” values you a looking for. If, by contrast you are looking to see if values are declining, you would likely select the ‘smallest” option.
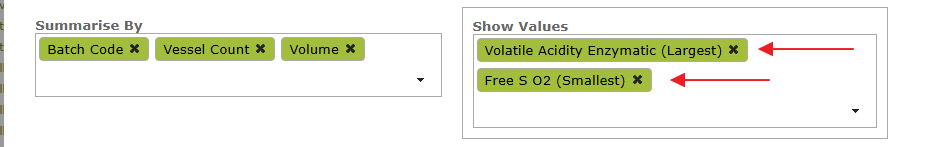
Using these selections, the Volatile Acidity Enzymatic value you see for each month will be the largest value recorded for this property over that month in any of the vessels with the selected Batch Code. By contrast, the Free SO2 value you are seeing is the lowest value recorded in that month.