Overview
There are many pre-formulated reports available in Vinsight. In addition, reports in Vinsight are able to be customised (to varying degrees) using filters, grouping and other options to help you obtain the exact information you are after. This document will guide you through the various customisation options available on reports.
In this document:
Finding Reports
Reports are found on the following Dashboards (Workbenches):
Grower Dashboard, Operations Dashboard, Sales Dashboard, Purchases Dashboard and Accounts Dashboard.
They are also collectively found in Reports.
Can’t find the report you are after? – Creating Customised Reports . . .
The Sales by Period report is a broad, general report that forms the basis of many (but not all) of the more specific sales reports. For this reason the Sales By Period report is a good place to start when looking for any sales information not obviously covered by a more specific report. The Purchases By Period provides similar generality on the purchases side. Other reports can also be manipulated to varying degrees using filters and custom options, as described in more detail below.
Refining Data Using Date Selectors and Drop-Down menus
Date Selectors:
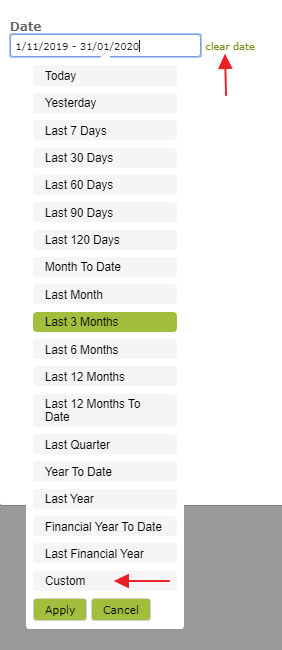
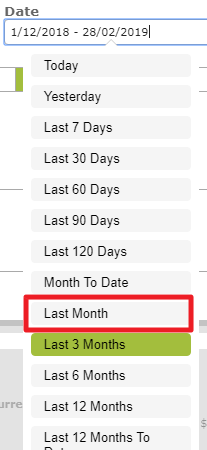
Many reports allow you to select the date range for the report. A default date range will be inserted by the App. To change from the default, simply select a new default period from the drop-down list or choose the ‘Custom’ option to enter a custom date. To remove date parameters altogether, click ‘clear date’
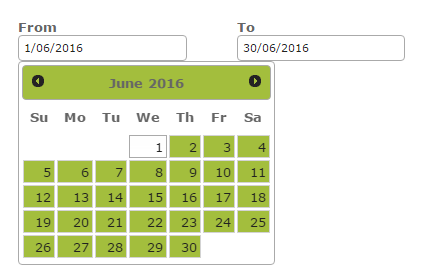
If the report has the following date format, simply edit the ‘From’ and ‘To’ text boxes to change from the default settings.
Filters:
In most reports, just below the Date Selectors, there are drop-down menus which provide you with a number of ways to refine the information to be displayed.
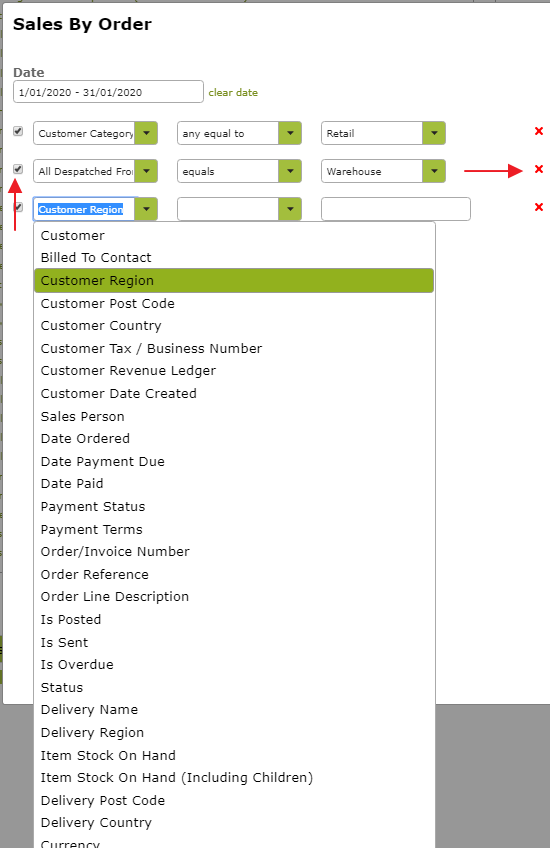
In the following example we have refined the Sales By Order Report so that it only displays sales to retail customers dispatched from the ‘Warehouse’. You can select as many such restrictions as you wish. To de-select a line, simply click the ‘tick’ on the left, so that it changes to an empty box. If you later want to add the filter back in, just re-tick the box. If you want to get rid of the filter altogether, click the red cross next to the line in question.
All conditions match / Any conditions match:
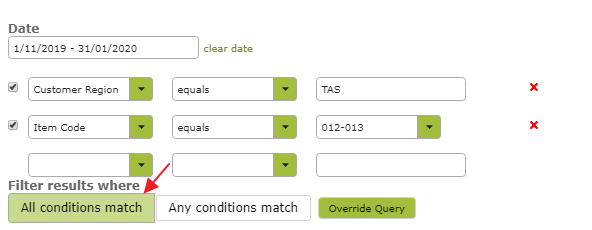
By default, these filters will find results that match every one of the conditions listed. This means in the following example the report will find all sales where the Customer Region is Tasmania and the Item Code is 012-013.
If you want results that meet any one of a number of restrictions, you can do that by selecting the ‘Any conditions match’ option under the filters.
In the example below, we have selected the ‘Any conditions match’ option, meaning the report will find all sales to customers in either Tasmania or Victoria.
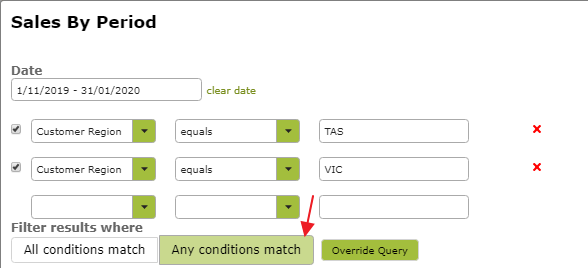
If you selected ‘All conditions match’ in the above example, no items would be returned as there will be no customers who’s region is set to both Tasmania and Victoria.
Override Query
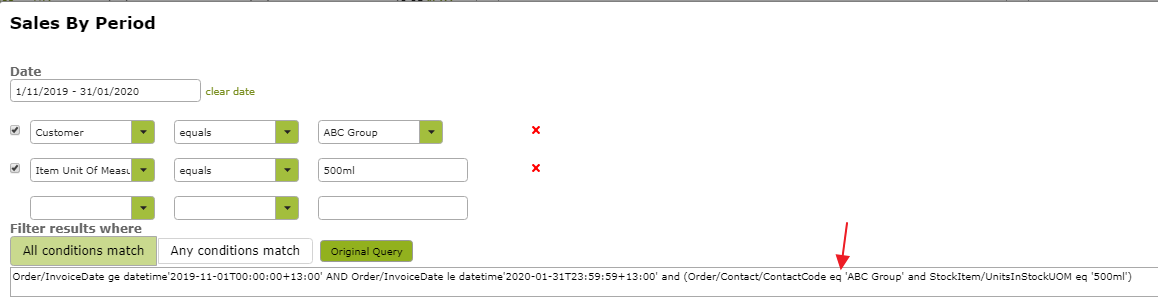
If you are a confident programmer and want access to the actual filters being sent, you can click the ‘Override Query’ button and edit the query filters from there. We do not recommend this option for those without experience. In general there would be little reason to go beyond the drop down lists provided.
Summarise By
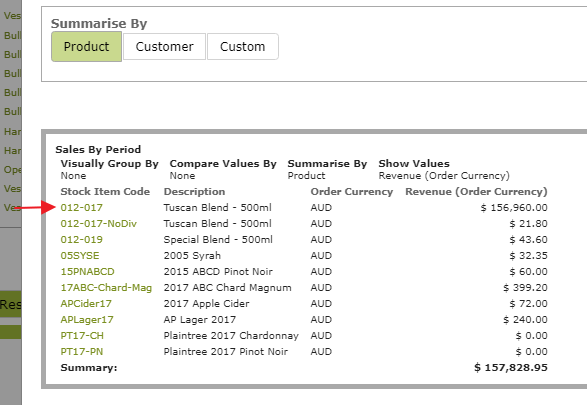
Some reports give you the option to summarise the results by various categories. If this option is available, the report will have buttons similar to the following:
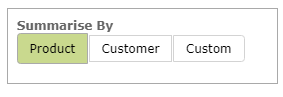
The summarising will result in a single line item for each category summarised by. For example, selecting the ‘Product’ option in the Sales by Period, will summarise sales of each product into one line item.
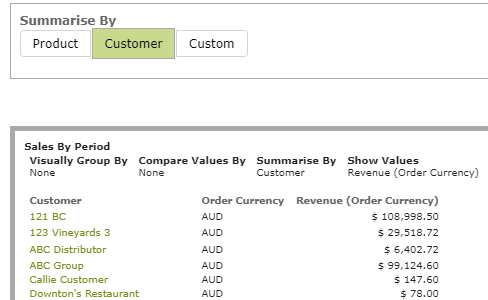
Similarly summarising by ‘Customer’ would result in revenue from sales to each customer be summarised into a single line item.
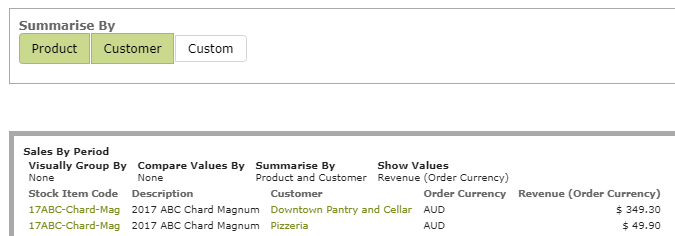
Selecting both Product and Customer, would produce a single line item for the sales of each product to each customer,
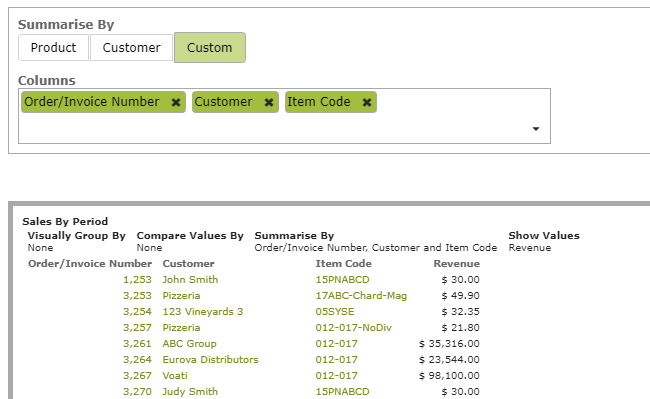
Custom Summarising
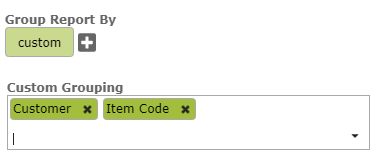
Some reports allow ‘Custom’ summarising. If this is available, simply click the ‘Custom’ button and then select one or more categories to group by from the ‘drop down’ menu in the ‘Custom Grouping’ text box.
For example, you could turn the Sales by Period into a much more detailed report by summarising by Invoice Number, as well as Customer and Product. . .
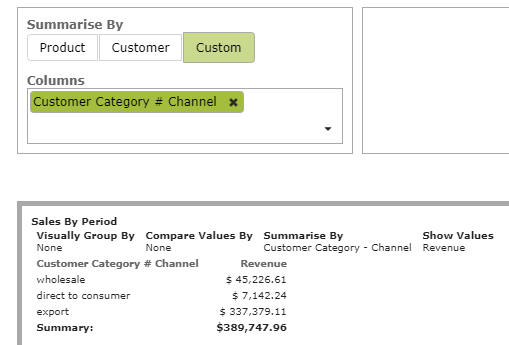
or much more general report by summarising by e.g. a Customer Category:
Visually Group By / Group By
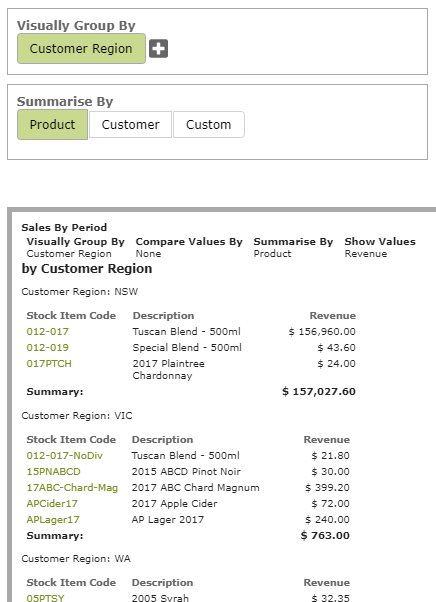
Visual grouping provides another way to display the results of a report. In the following example from the ‘Sales By Period’ report, visually grouping by ‘Customer Region’ causes the sales of the summarised product to be visually displayed and totalled by customer region.
If you select more than one category to group by, the report will group first by the first category listed, and then by the next.
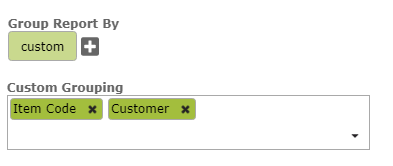
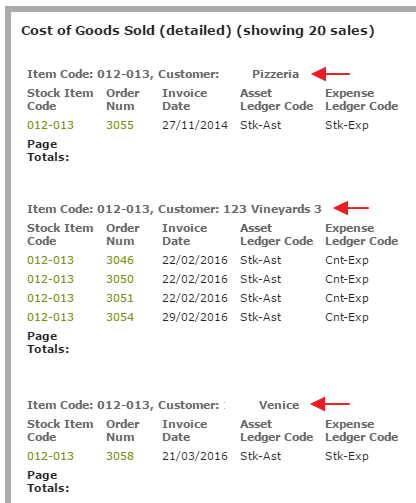
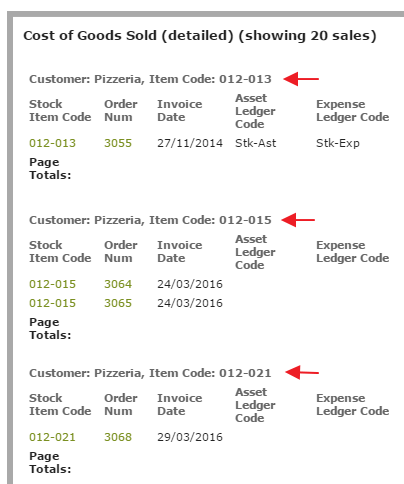
The following examples come from the Cost of Goods Sold (detailed) report. In the first example ‘Item Code’ and then ‘Customer’ are selected in the Custom Grouping text box. This causes the results to be grouped first by Item Code and then grouped by each Customer within that.
If the order is reversed, the report would first group by Customer and then, for each Customer, would separately group by Item Code, as below:
Compare By
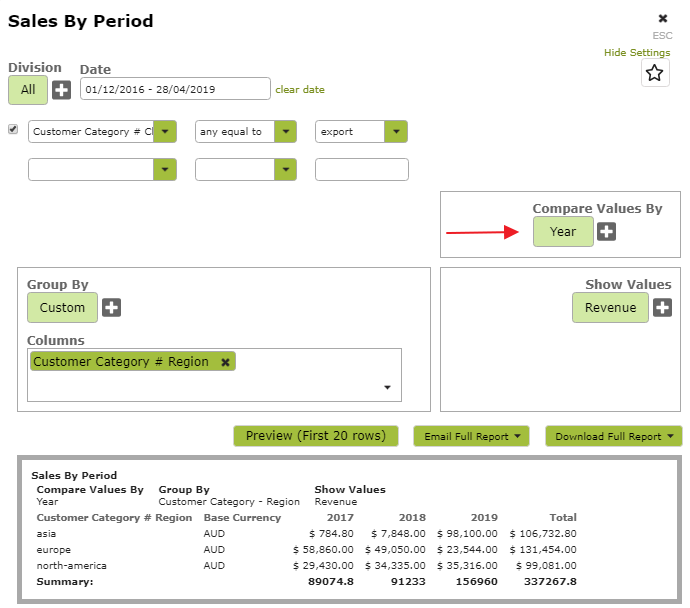
In addition to summarising and grouping, some reports allow you to ‘compare’ the results between, for example, different periods. In the following example we select the ‘Year’ option to compare export sales to specific regions over different years.
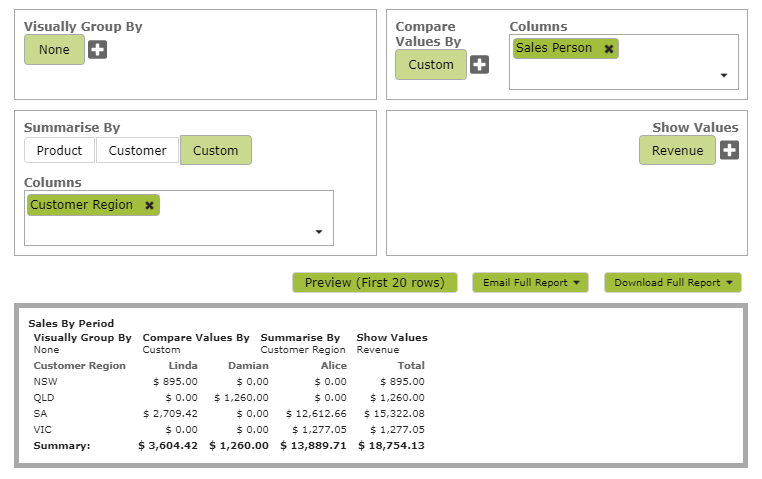
While the default options for ‘Compare By’ are generally time periods, such as Year, Month, Quarter etc., you sometimes have the option to select a custom ‘Compare By’ if you wish to compare different properties. In the following example, we are comparing Region Revenue by Sales Person.
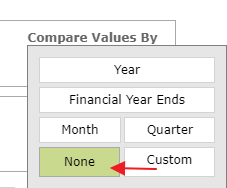
Compare by works best when you have a single value (such as Revenue) that you wish to compare over various periods or other categories. While you can use Compare By with multiple values selected, the resulting table can get big (and consequently difficult to read) quite quickly.
To turn off the Compare by function, simply select ‘None’ as the Compare By value.
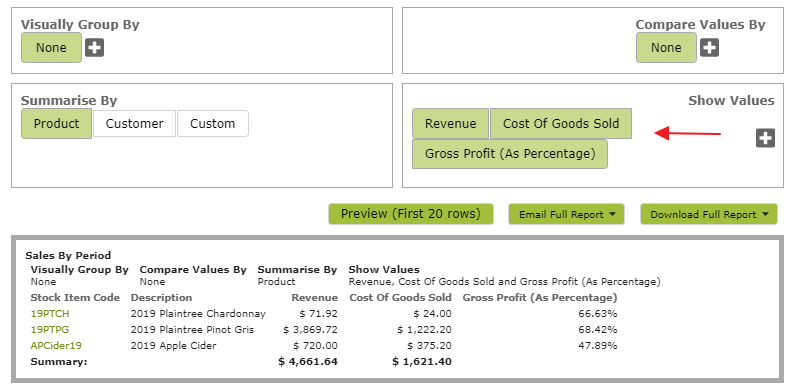
Show Values
The last variable you can select when constructing reports are the values. Values are essentially the columns that you want to display. In the following example, the rows have been summarised by product and we have chosen to display the columns Revenue, Cost of Goods Sold and Gross Profit for each row.
Units of Measure
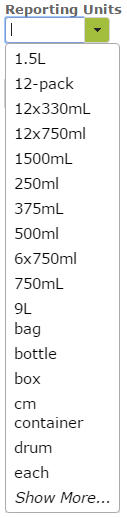
Some reports give you the option to display the results in different ‘Reporting Units’. This enables you, for example, to display the results in 750 ml bottles instead of litres or gallons.
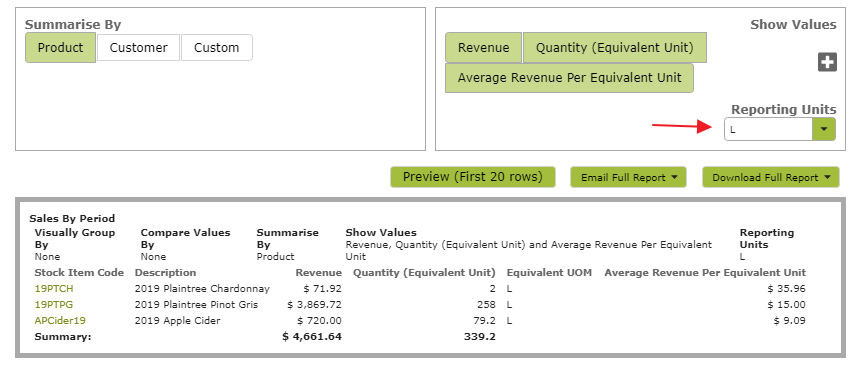
If available, select the Unit of Measure you require from the drop down list provided, before previewing the report.
Favourited Reports
If you find yourself constantly entering in the same report settings into our reports, you may find it useful to save the report as a favourite.
For example in a Sales By Period report you may want to be able to quickly see all of the sales in the past month without having to change the date setting each time you open it. To save the settings in a report for future use, take the following steps
Step 1: Select the appropriate date and filter settings in the desired report:
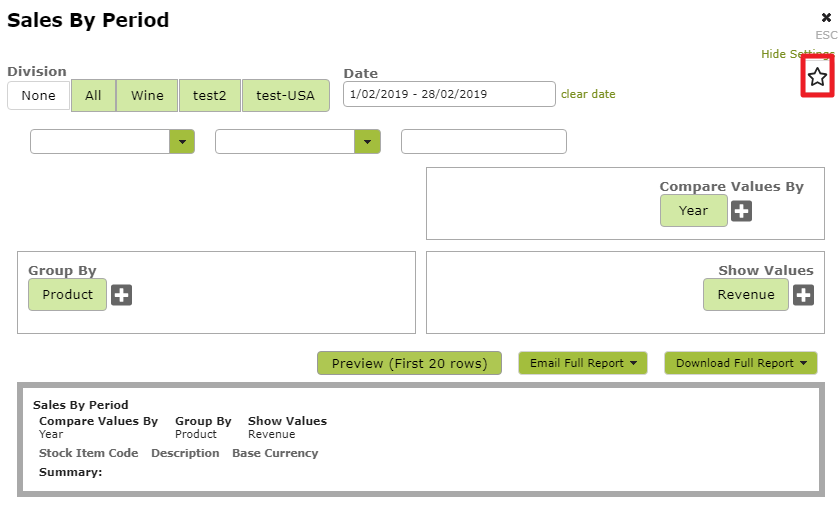
Step 2: Click the star in the top right corner of the report settings to favourite the report with it’s current settings
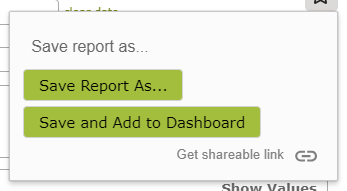
Step 3: Choose whether or not to add the report to the sales dashboard (Will show up as a list item in the report dashboard regardless)
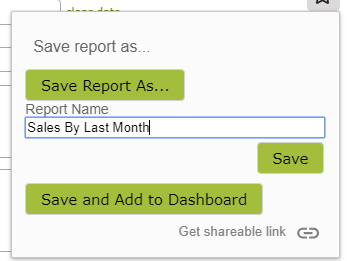
Step 4: Set the report name and save
Your favourited report will now show up on the reports dashboard with a star next to it as is shown below.
Previewing, Emailing and Downloading Reports
Once you have refined the data you with to obtain (using date selectors, grouping etc.), you have the option of previewing the results on the screen, downloading or emailing the report.
It is a good idea to preview the report before downloading it, as a check, to ensure you have selected the correct filter criteria, dates etc.
If you are only after a small amount of data (i.e. less than 20 lines) it may be sufficient to view this ‘Preview’ on screen. However for larger data sets, you will need to download the report to get the full picture.
In particular, exercise caution when viewing ‘Total’ and ‘Summary’ information in ‘Preview’ mode. Unless it specifically indicates otherwise, the last total in the ‘Preview’ view, will only be totaling data displayed on that page. For example in the ‘grouped’ report shown in the ‘Grouping‘ section above, the summary information for ‘Product 012-021’ will total the information displayed only. If there are additional orders relating to this product on the next page, these will not be included in the totals provided. To ensure you are reading the correct totals, it is important to download the full report.
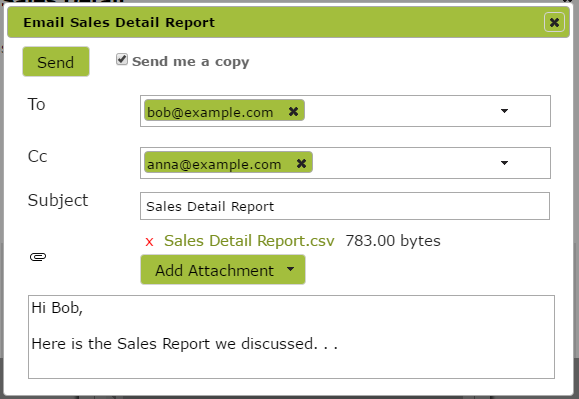
Emailing Reports
Clicking ‘Email Full Report’ will set up an email with the full report attached.