Flexible Sales Reporting
Vinsight has some great reporting particularly sales reporting, allowing reporting on Revenue, Gross Profit, sales quantities in different units (eg the unit of the invoice or inventory units) along with abilities to summarize and drill down on specific data then save your settings as a new personal report.
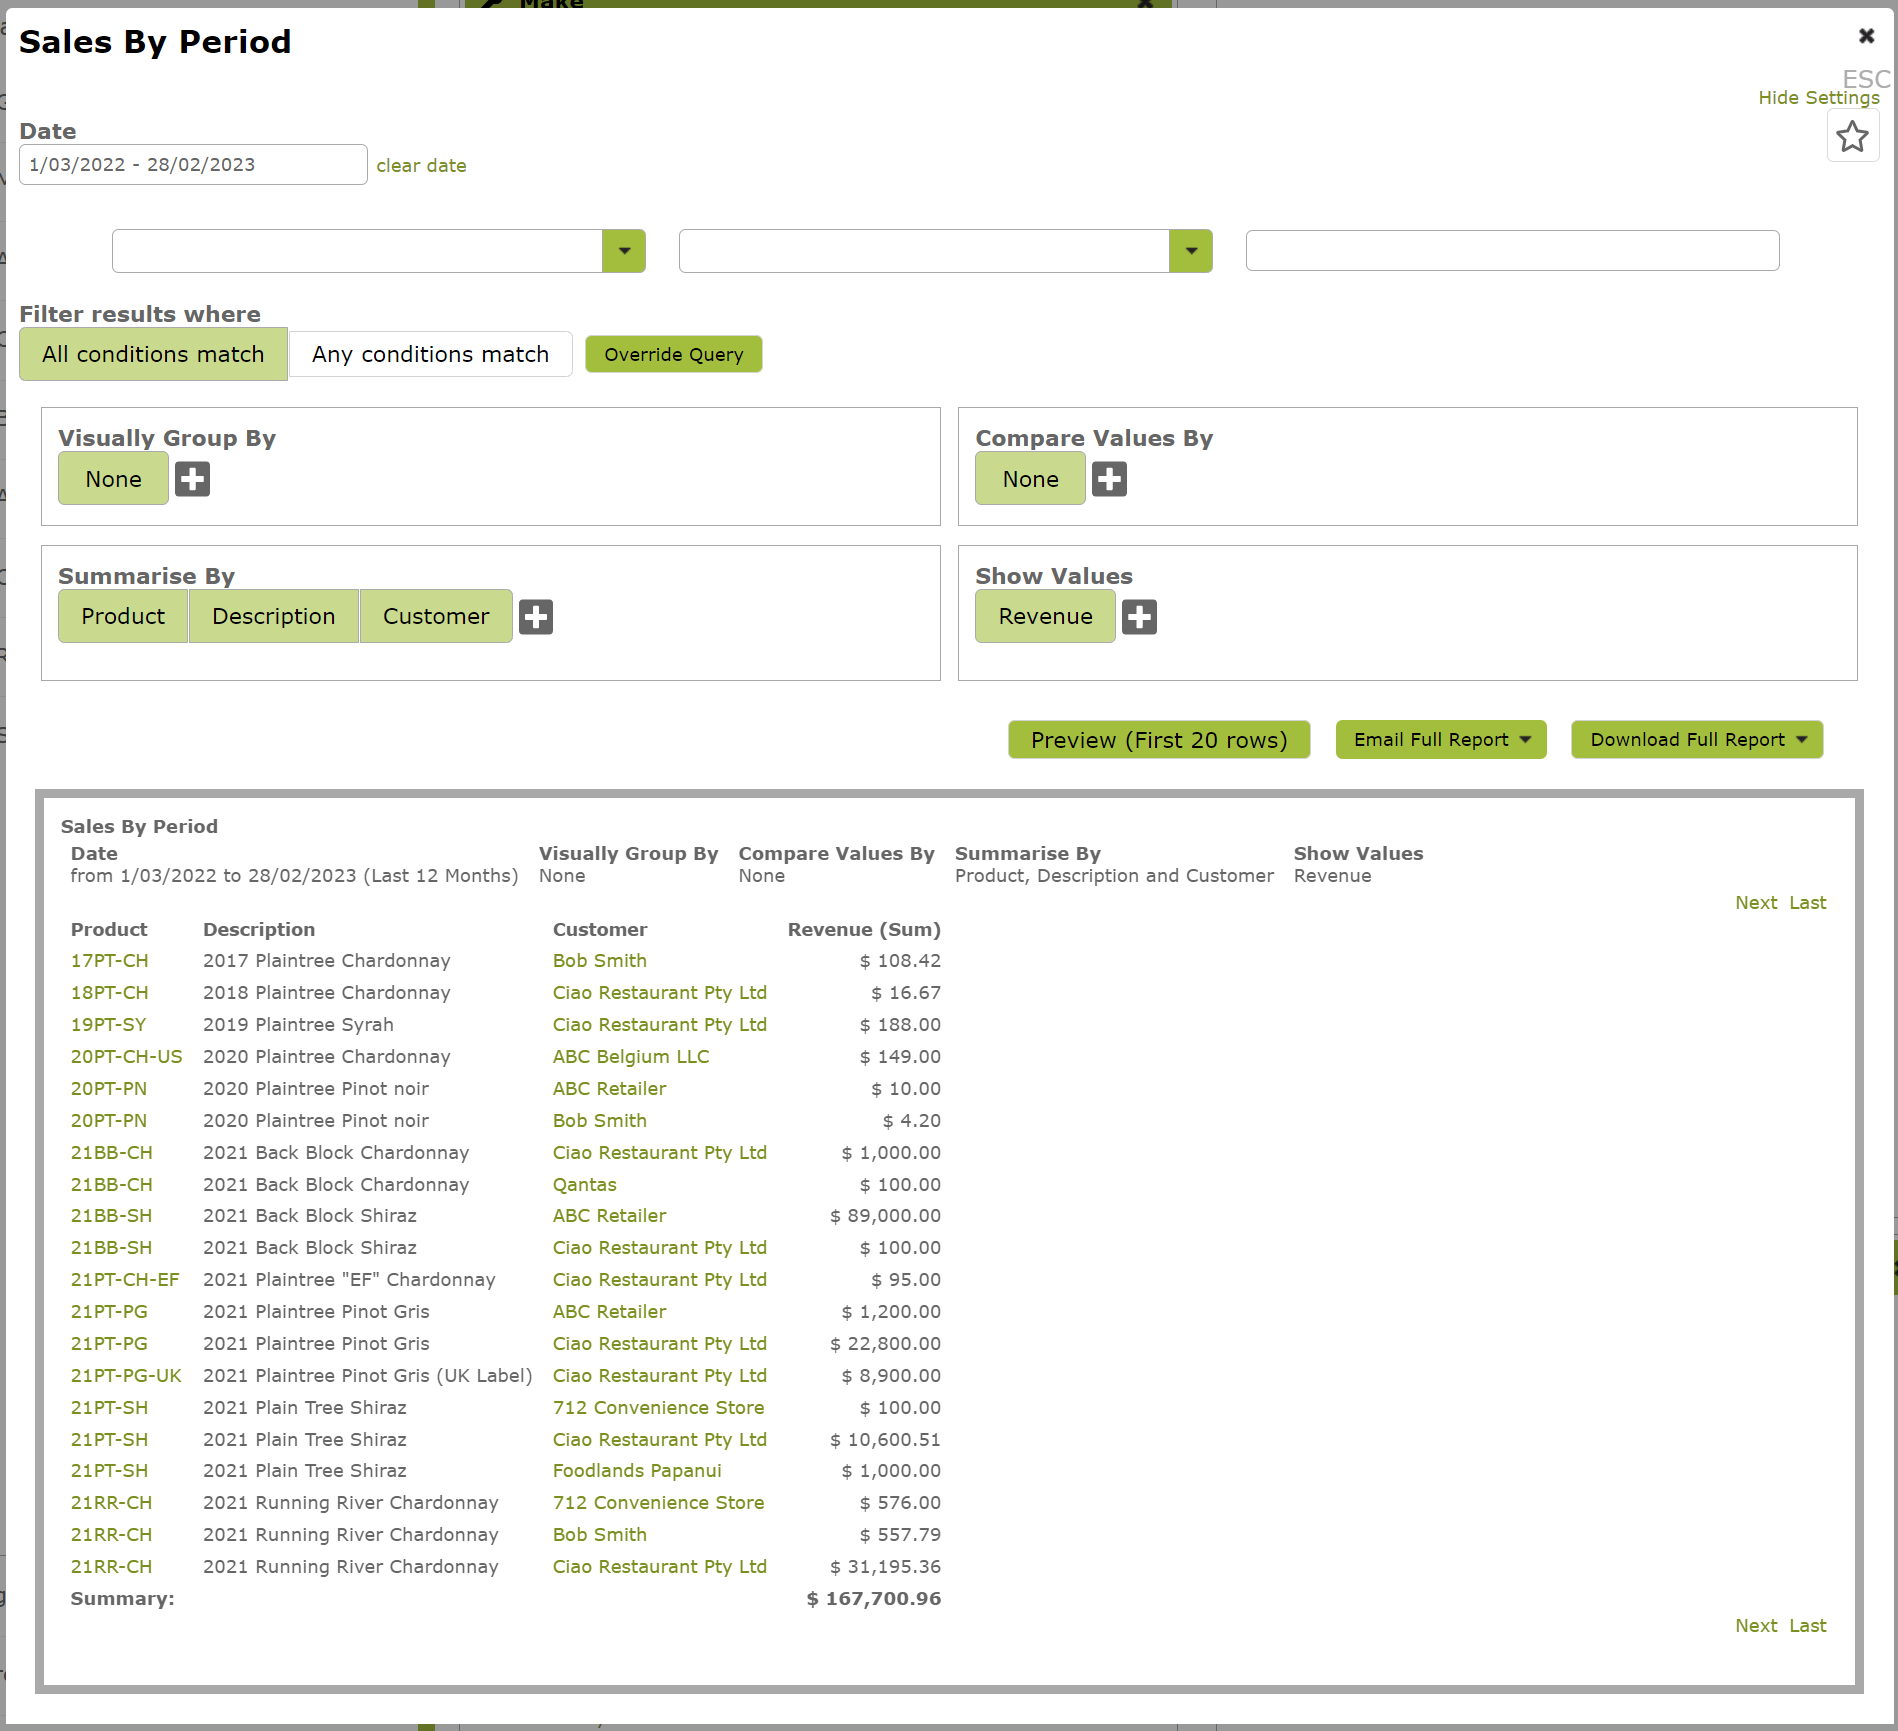
Lets start with a simple report that shows sales of a range of products over the last 12 months to various customers and it gives us the Revenue.
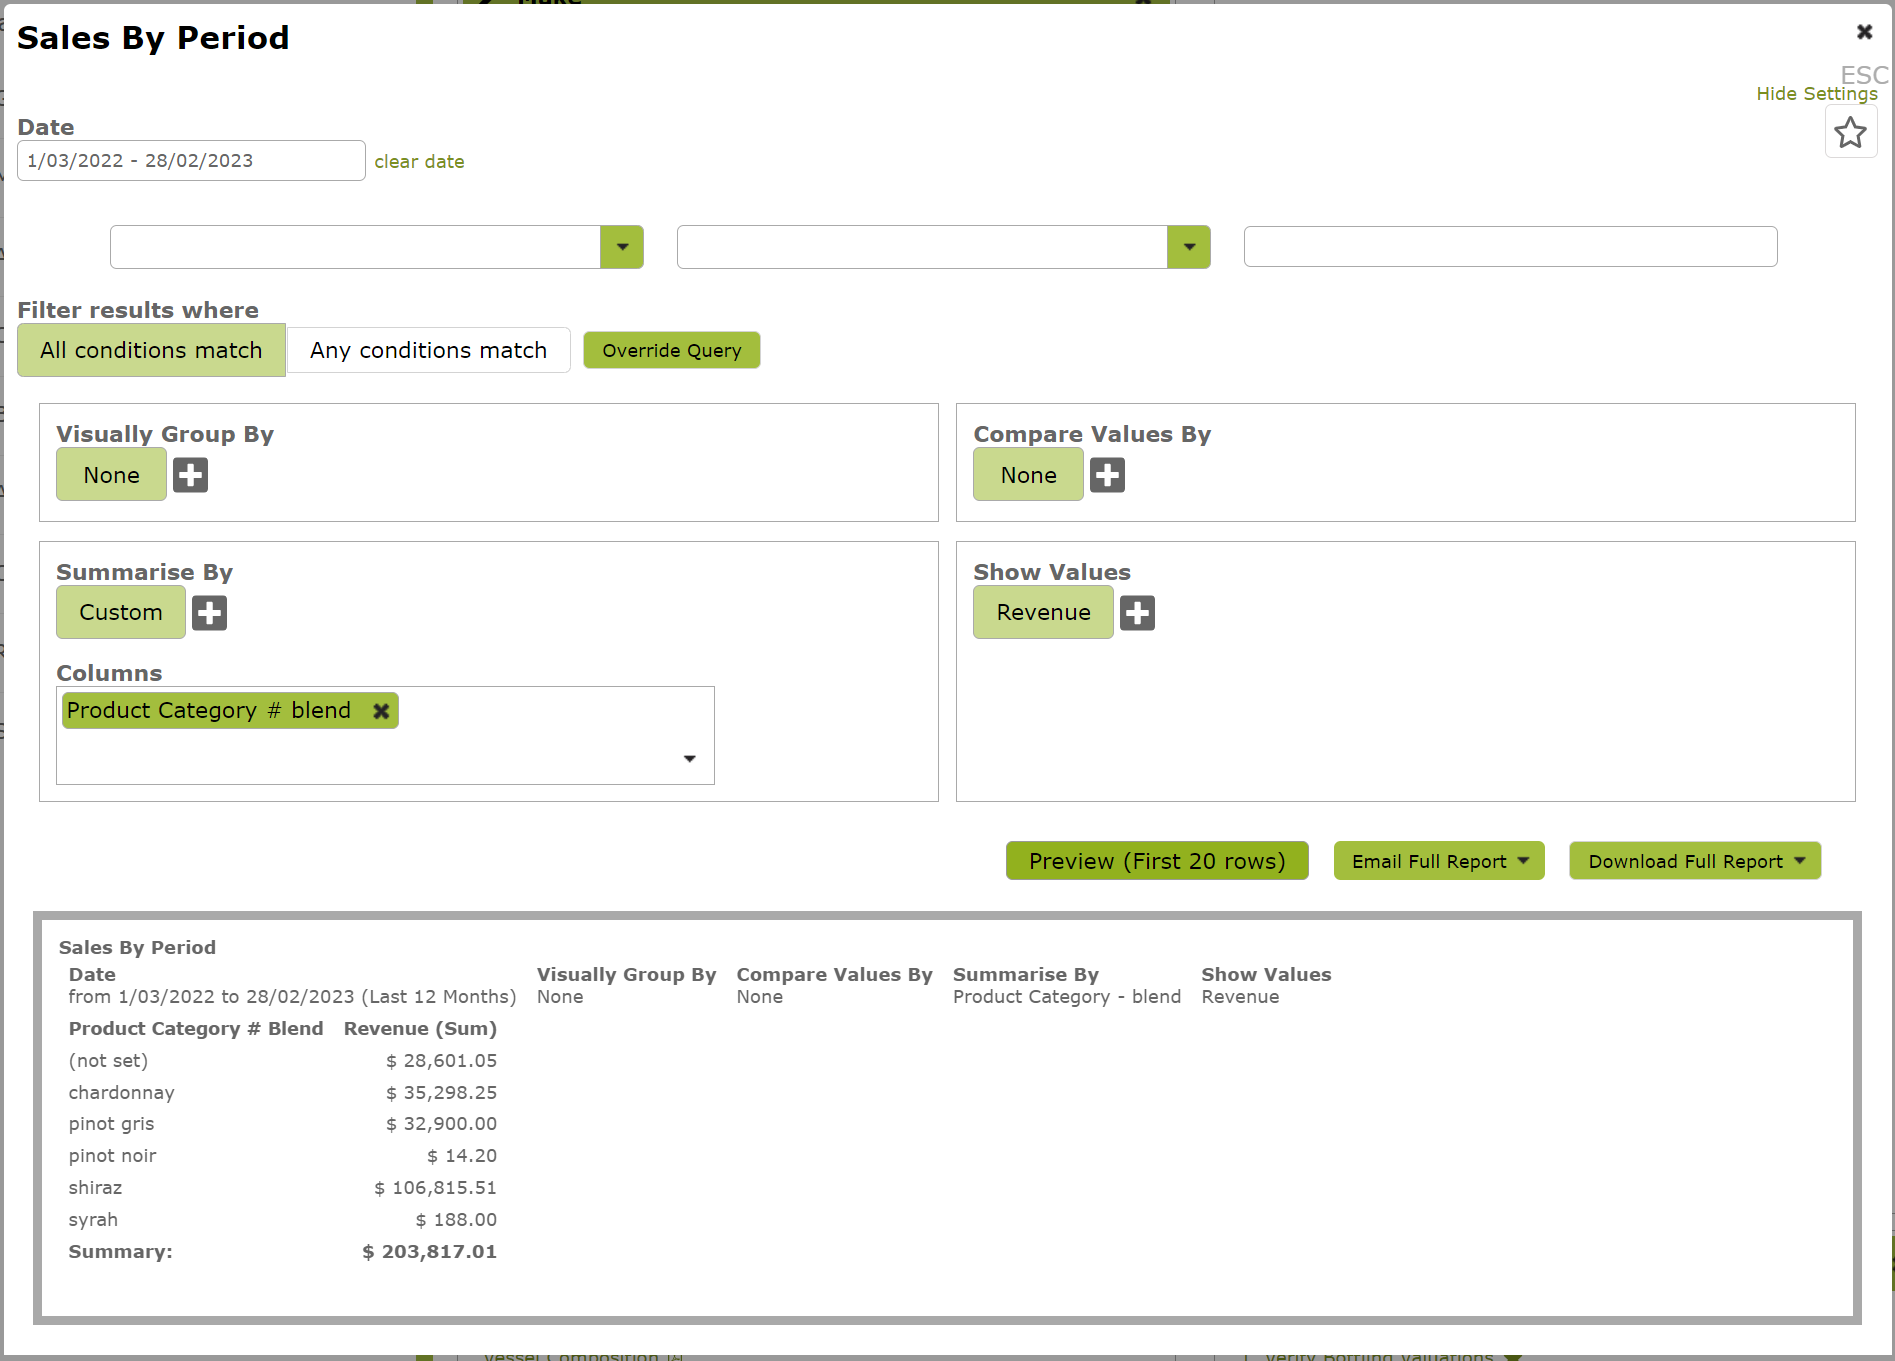
This is nice but we see that there are a lot of similar products eg 4 or 5 Chardonnays, Shiraz etc that make the report look busier than we want, so we can change the “Summarise By” settings to use one of our Product Categories that is user creatable, in this case “blend” and we remove the customer from the setting:
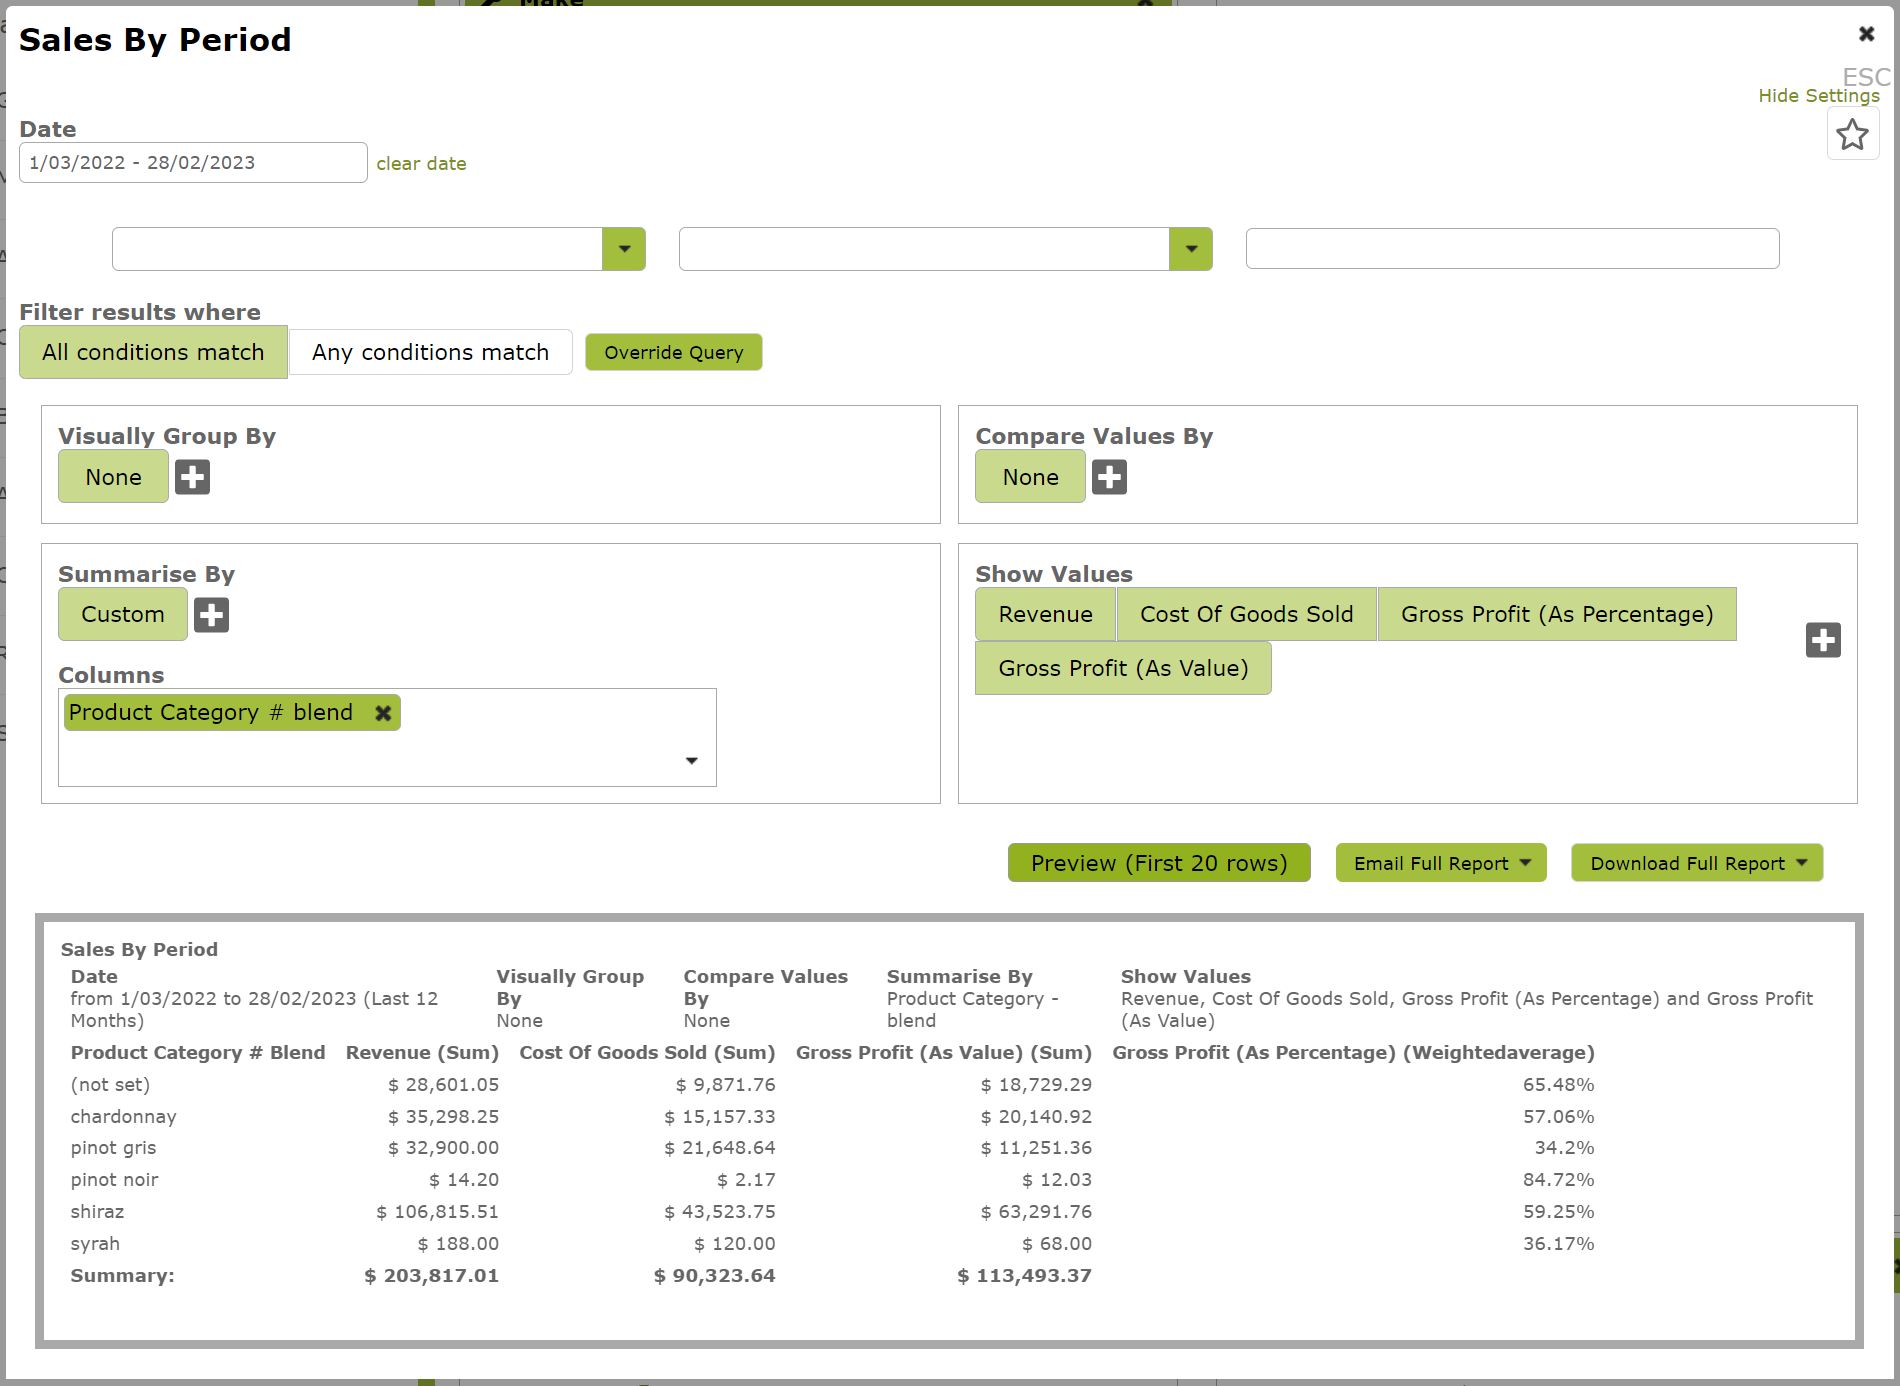
Now we see a simple report showing us all of those sales simplified into the Revenue by “blend”, but it does not tell us which is more profitable, so we can add the “Cost of Goods Sold” (the quantity x per unit cost) and that can give us the Gross Profit both as a value and a percentage:
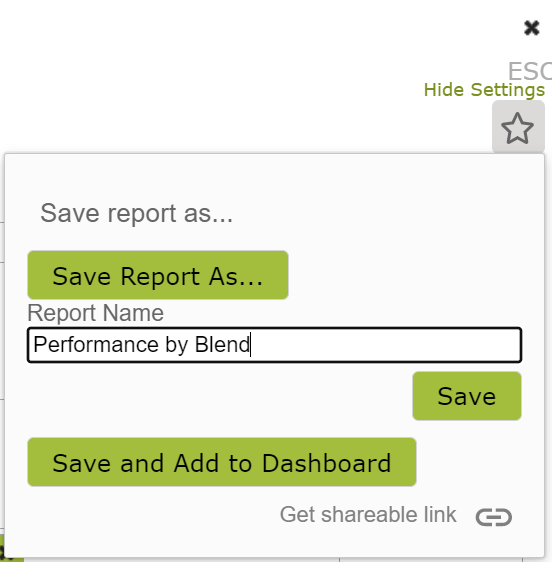
So now we have a good idea of gross profitability by blend, we could then save this if we wanted to use this again later, giving it a name of our own choice eg “Performance by Blend”:
However, perhaps we want to know which market segments or sales “channels” have the highest revenue turnover, so we can remove the profit fields and into the “Summarise By” add the Customer Category that we made “channel”:
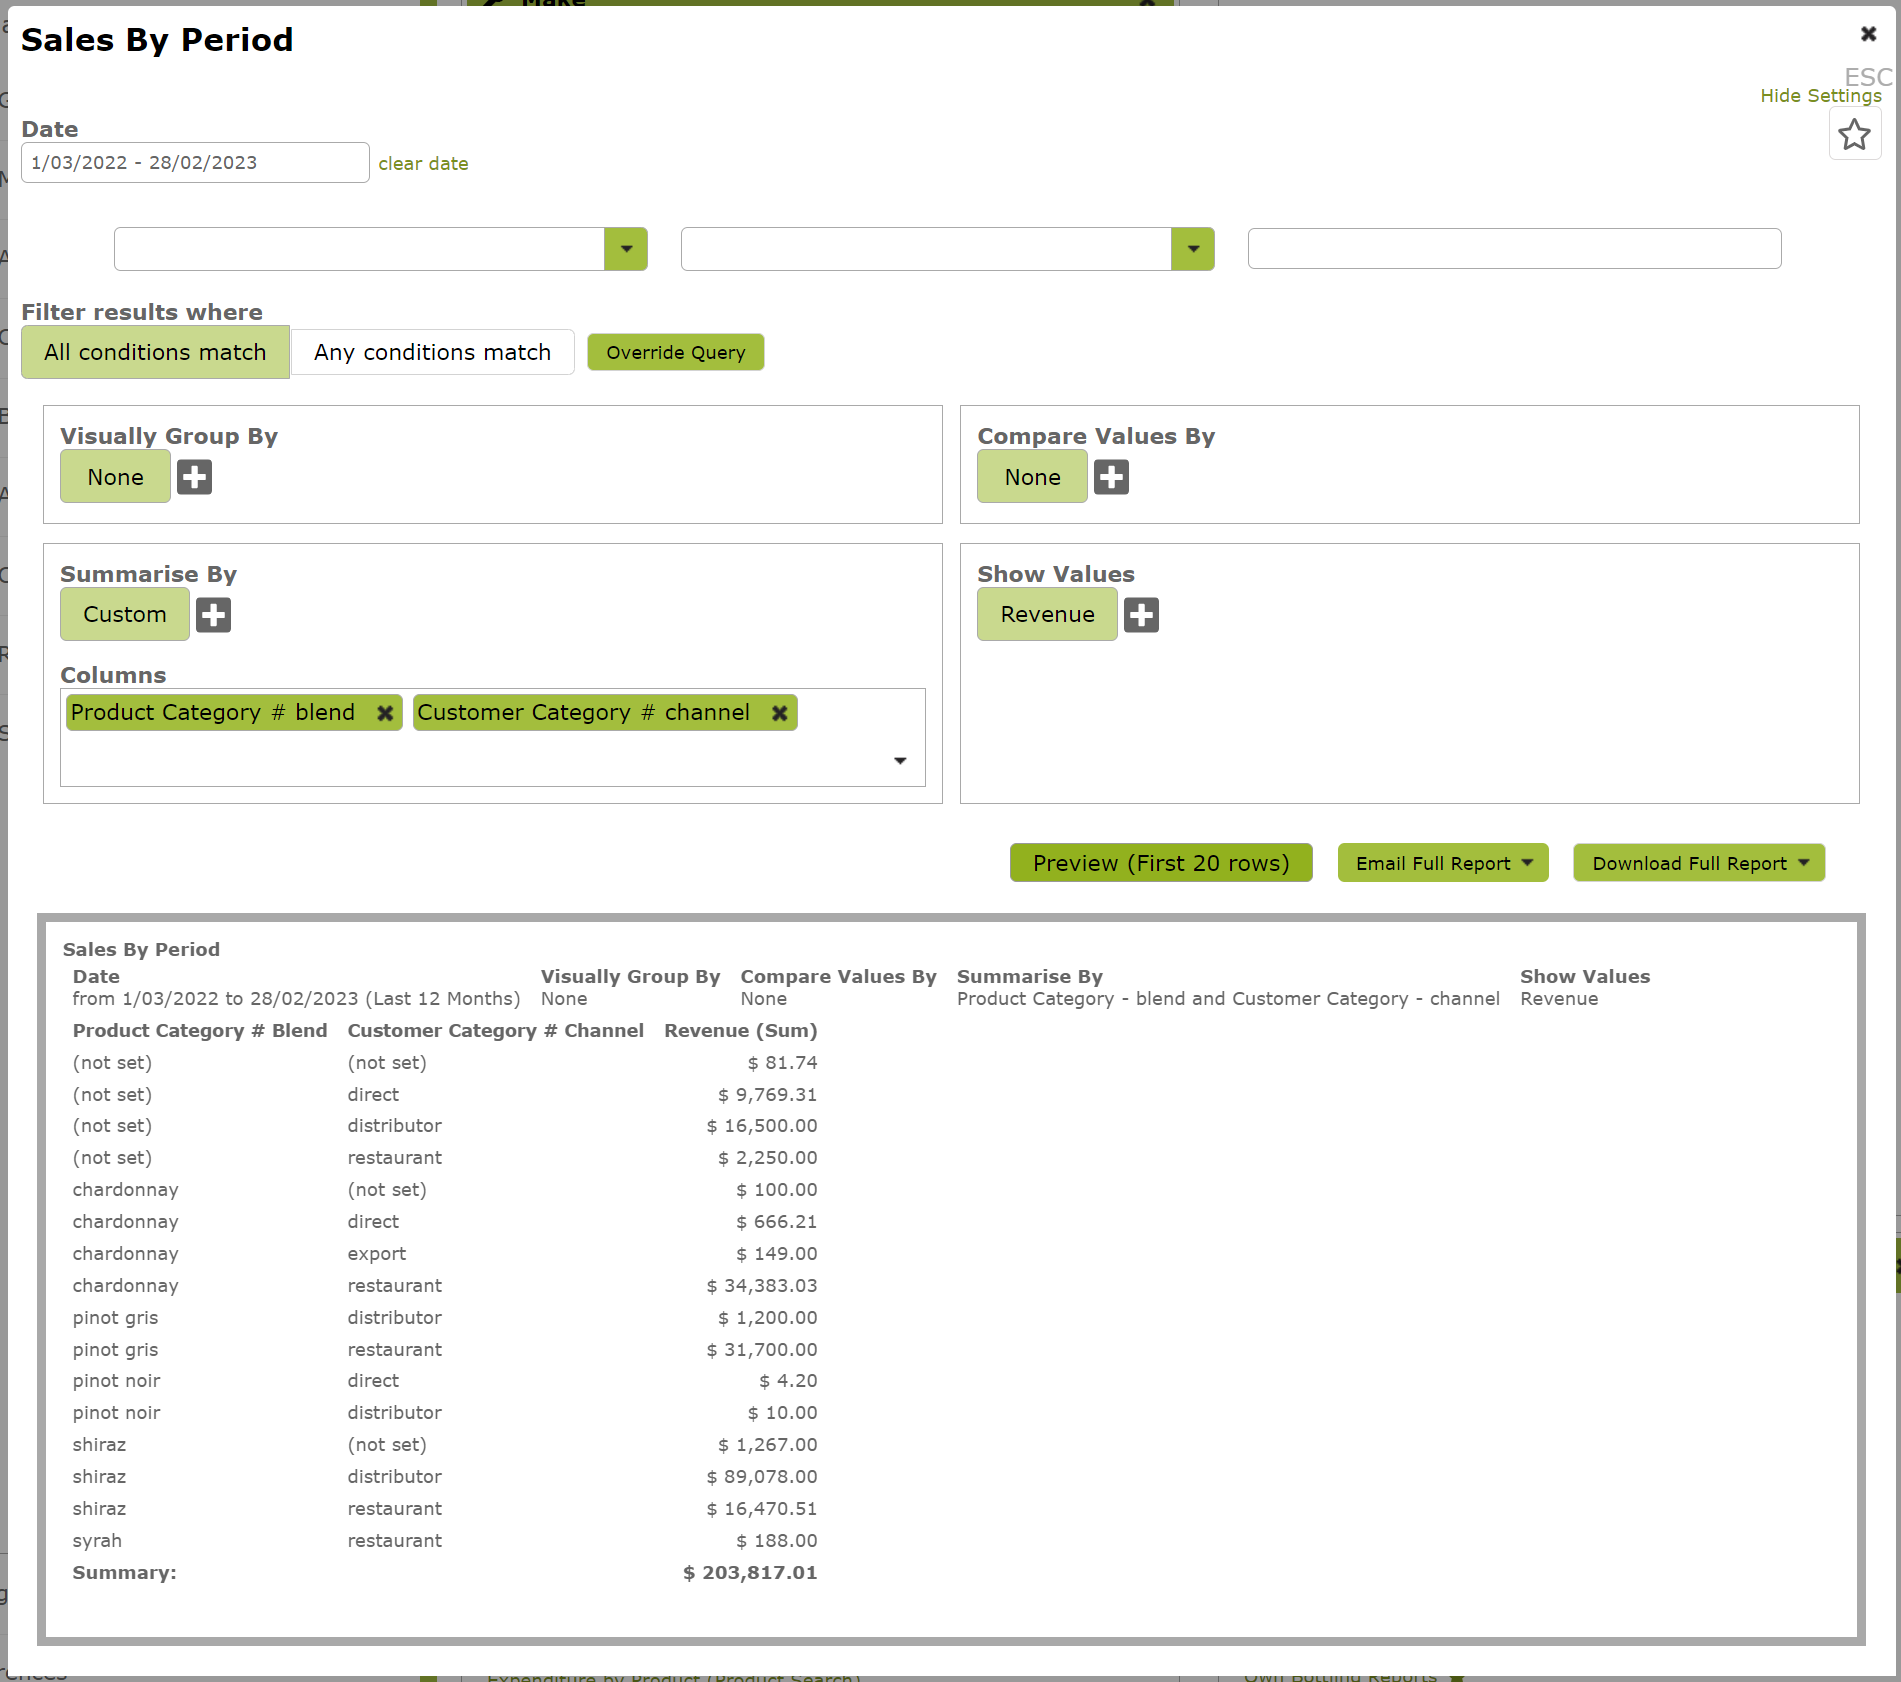
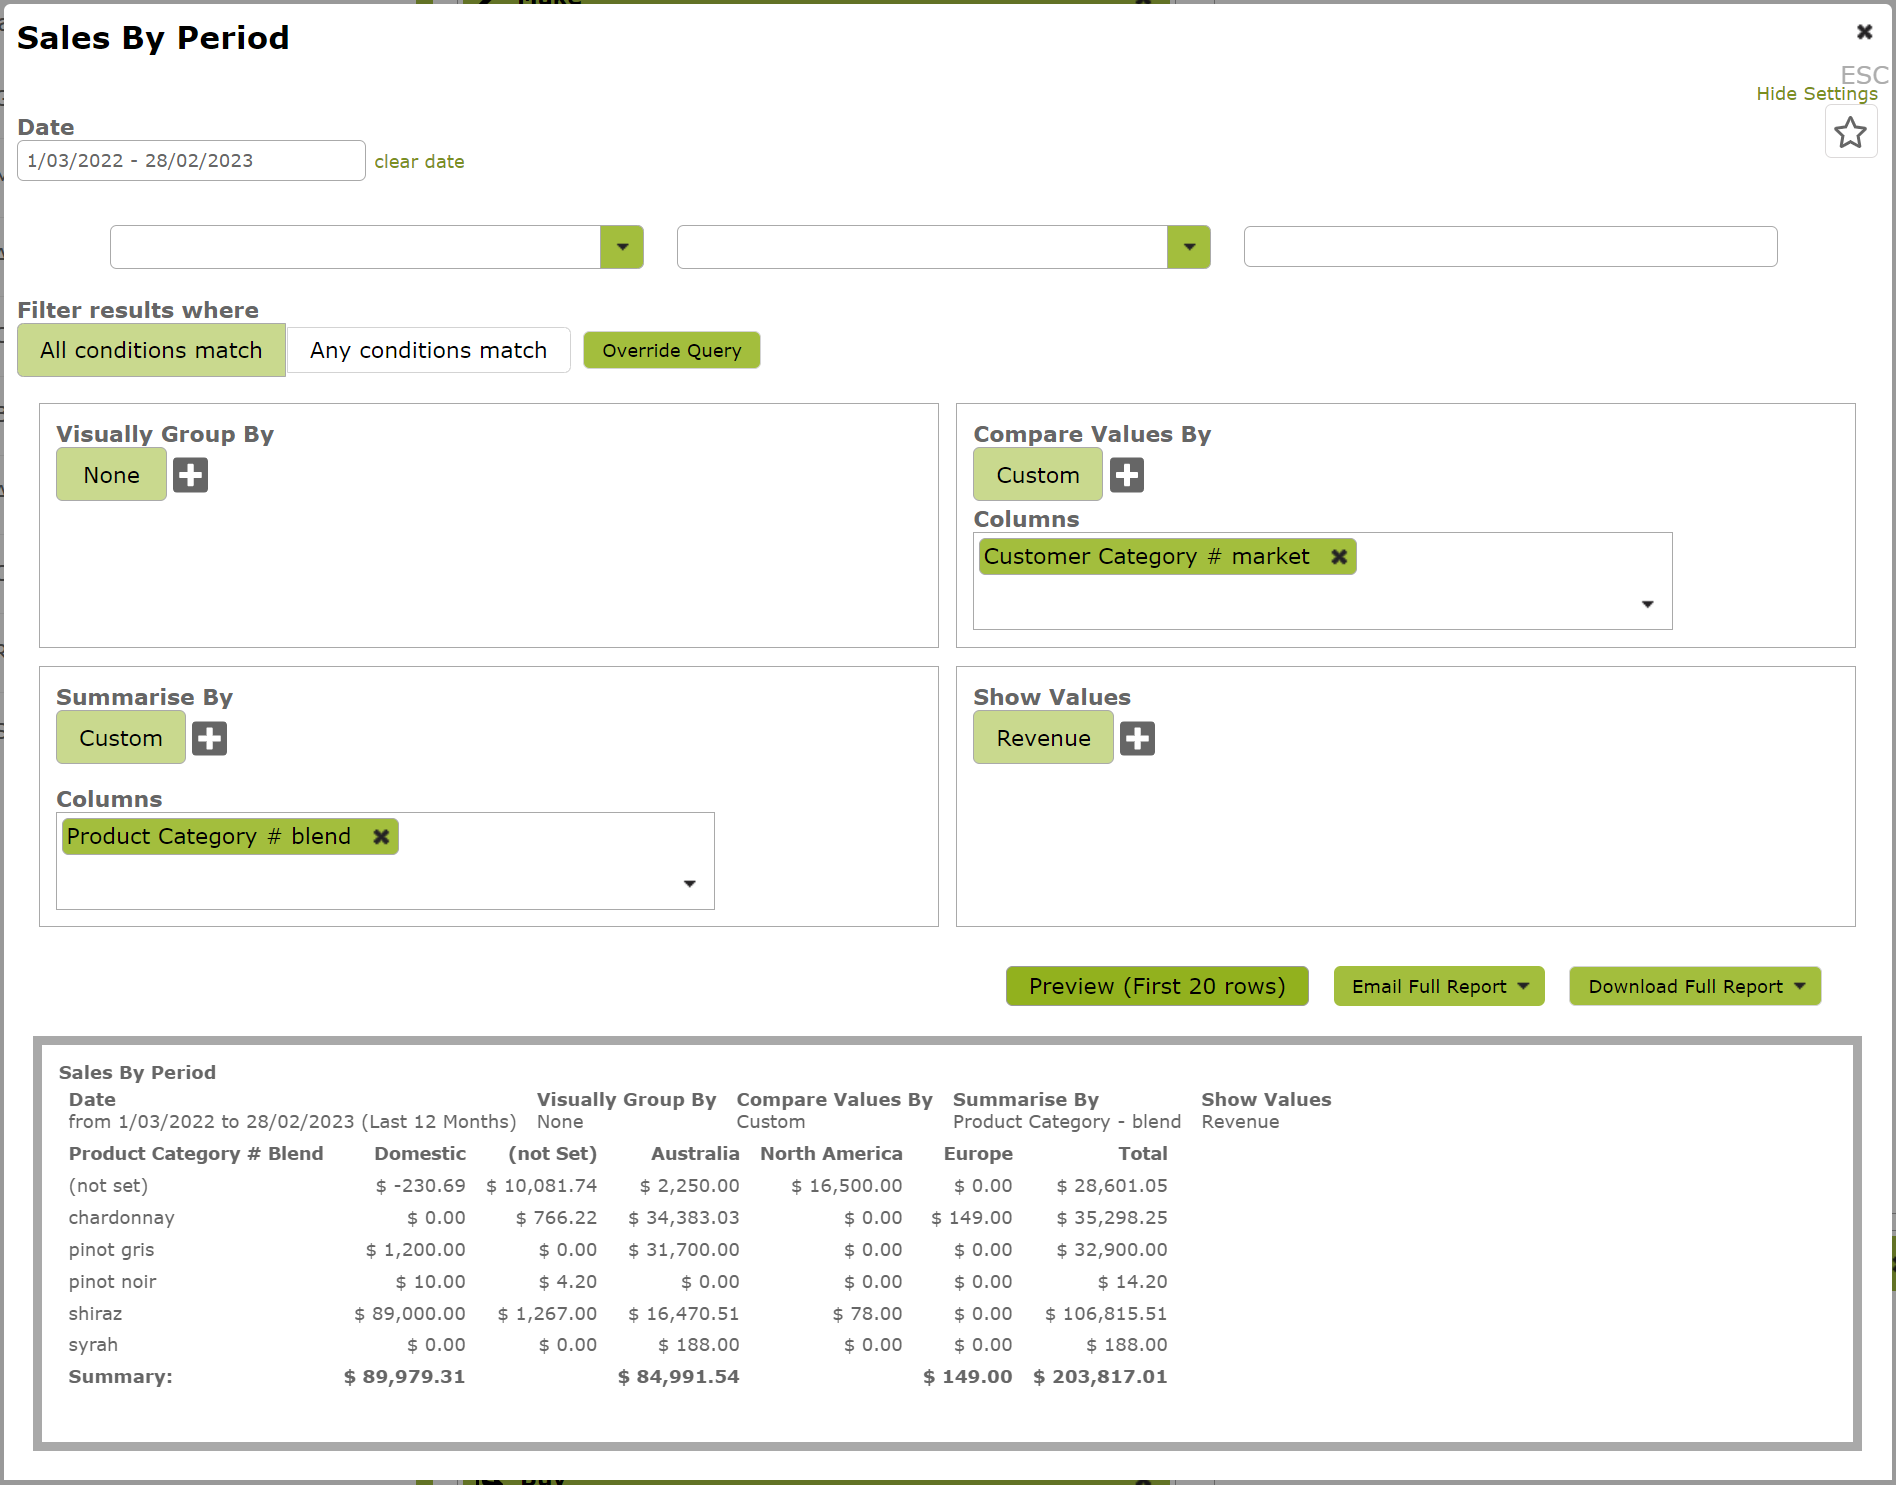
However this looks “busy” so one option is to use the built in pivot table feature that is so powerful but often hard to use in spreadsheet apps, you can do this by moving one value up to the “Compare Values By” setting:

To re-emphasise this, you choose and make the different product and customer categories, so if you wanted to have “region” or “market” for a customer, you would create that, add it to each customer, then you can use it on your report, below we have switched “channel” in the “Compare Values By” for “market”:
Hopefully the above examples show you how powerful, flexible and easy reporting is in Vinsight. Many other reports in Vinsight have this same flexibility but sales reporting is a great example of this.